Feb. 11, 2026
At Cabell Library, new Data Visualization Wall can bring complexity into focus
Share this story
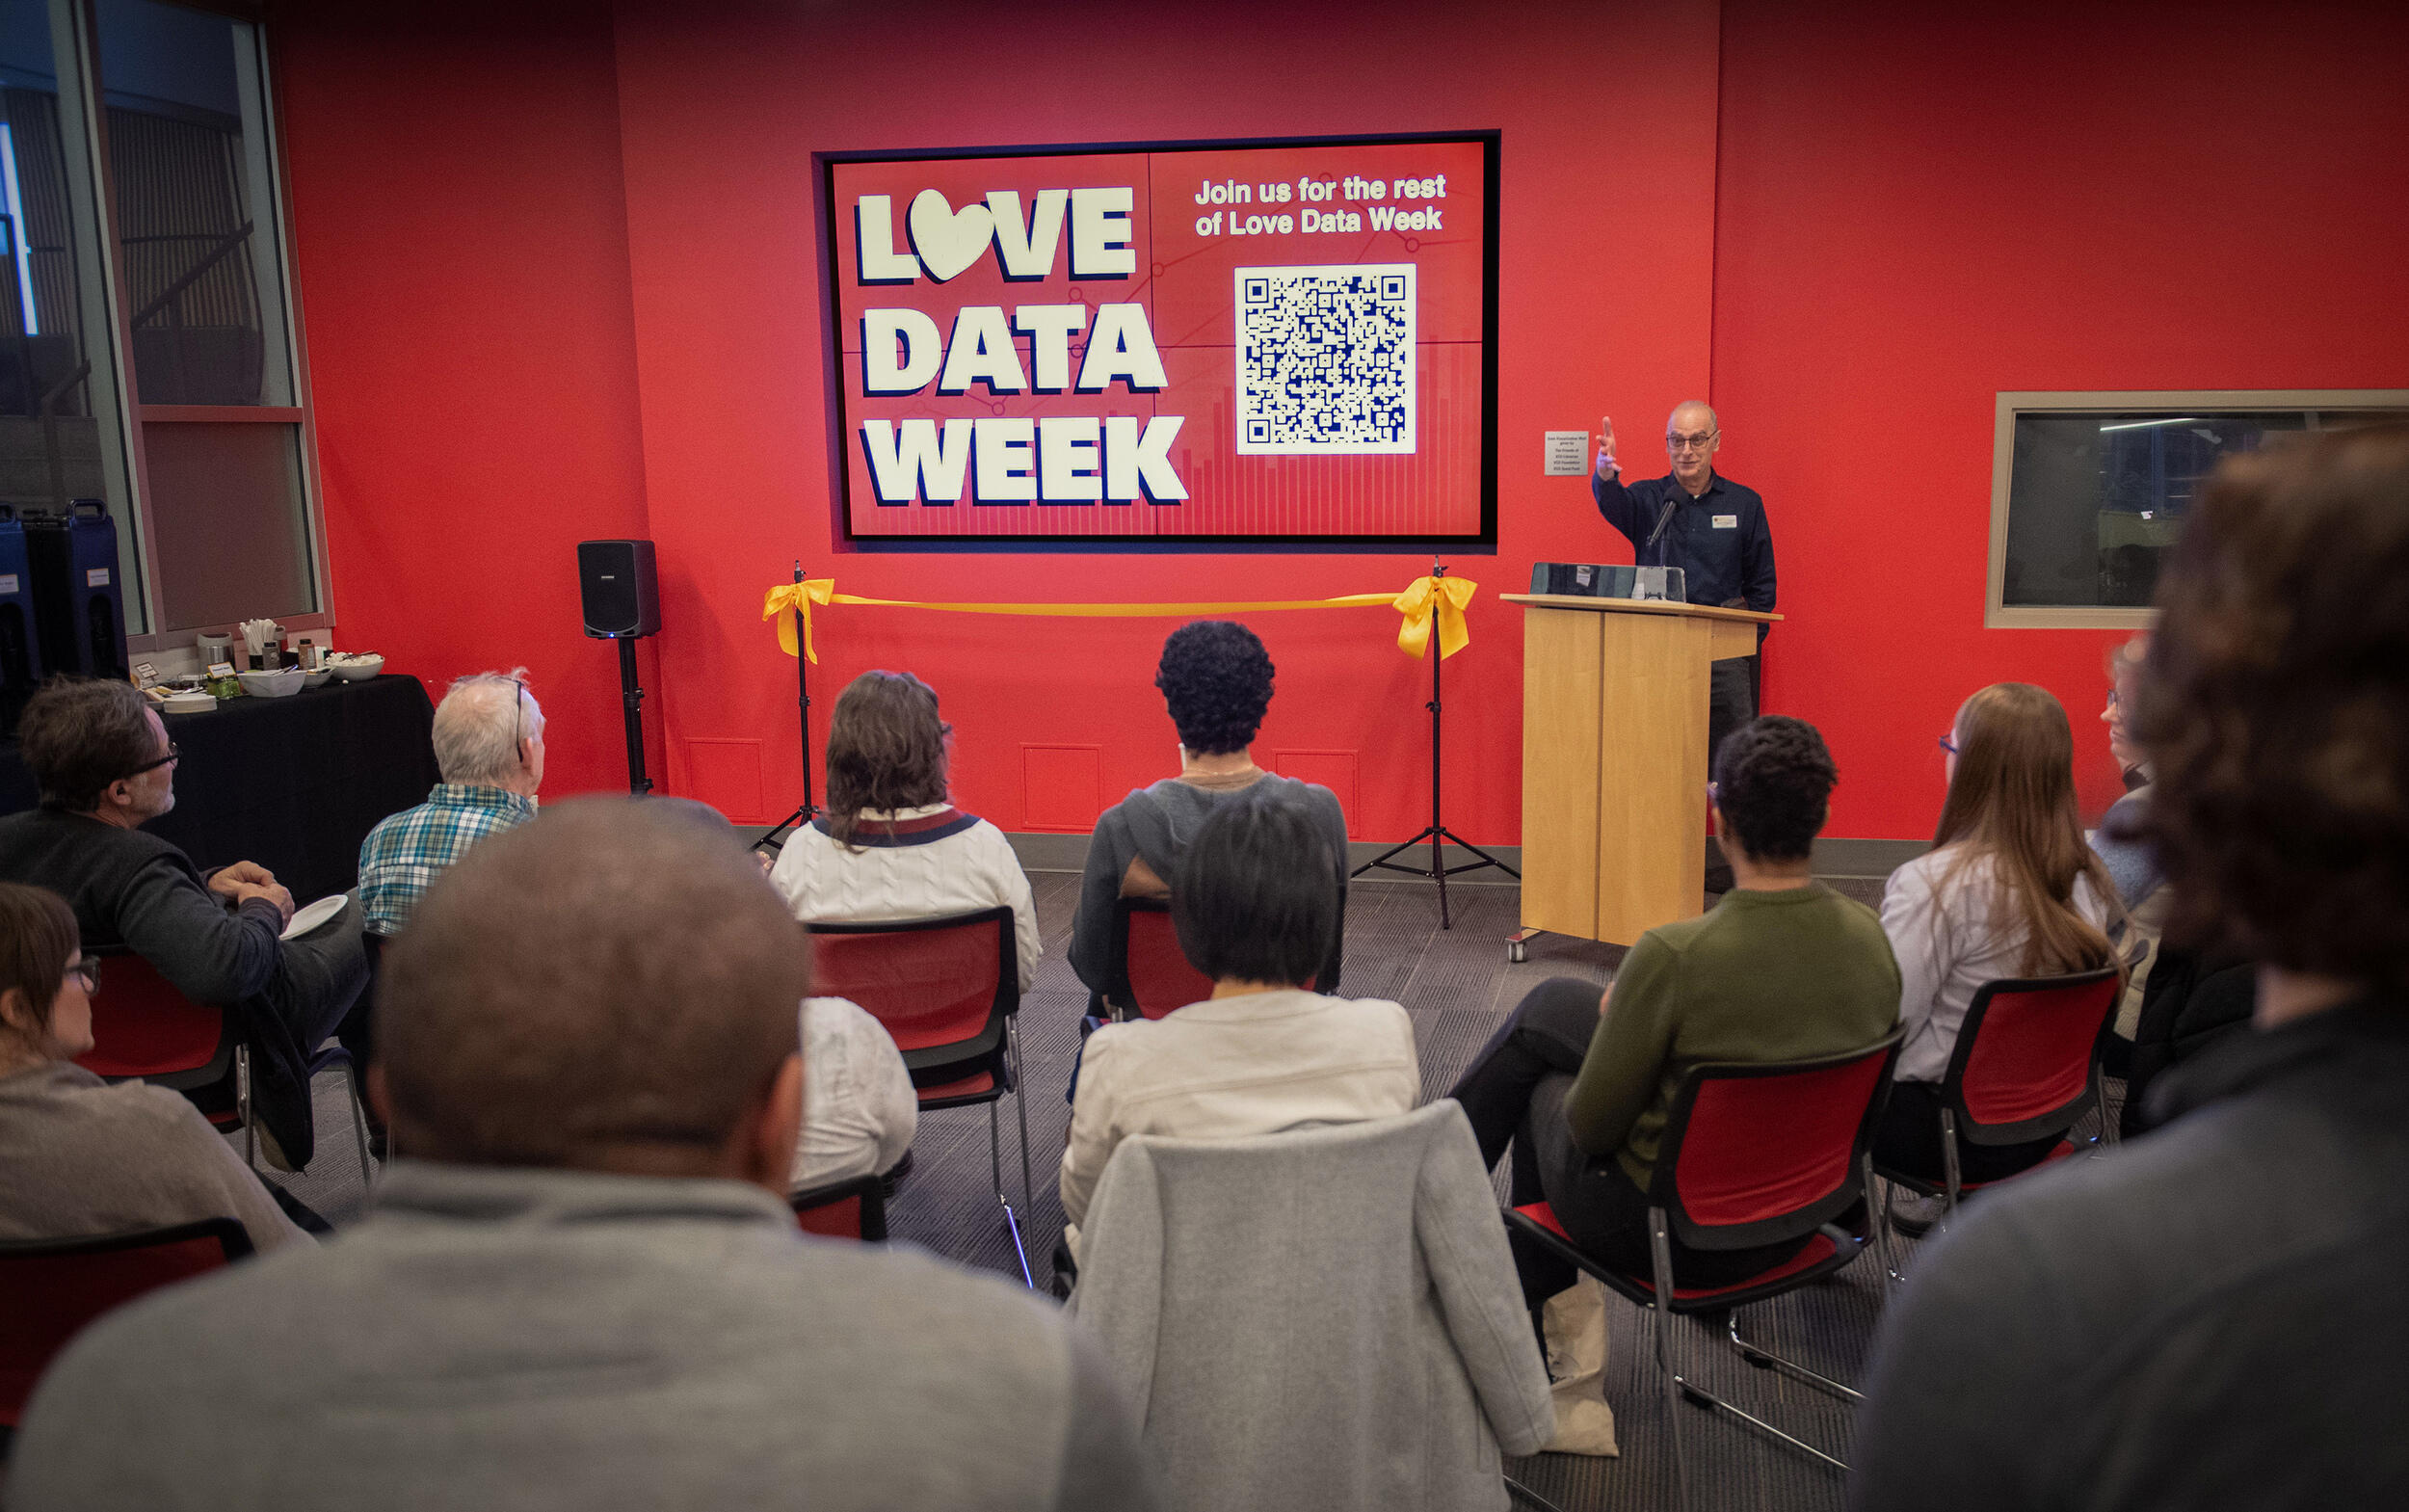
Cabell Library at Virginia Commonwealth University is making a big statement – as in, 4.5 by 8 feet – to engage students and support researchers. VCU Libraries this month unveiled a digital Data Visualization Wall that will inspire graphical communication of complex ideas and concepts.
Representing information through charts, graphs, maps, dashboards, animations and other visual elements can make data easier to understand and interpret. Data visualizations help users see patterns and trends and identify relationships and connections, which can inform decision-making from boardrooms to laboratories.
The Data Visualization Wall on Cabell’s lower level measures 110 inches diagonally and is composed of four Sharp NEC ultra-narrow bezel professional-grade displays with 3840x2160 resolution. The wall includes audio capability for presentations, with six speakers suspended in the surrounding space.
The wall is adjacent to The Workshop, a popular center for media design and creation and data processing. The flexible area will be converted to a learning space, with seating for presentations and events tied to visualizations created at VCU and beyond. The wall is available for use by all in the VCU community and VCU Libraries is seeking ideas and partnerships with faculty and their courses.
“People just love visualizations for illustrating data,” said research data librarian Nina Exner, Ph.D. “They’re beautiful and also help show the point. Visualization is such a key data skill, and data skills are always in demand.”
Exner expects the wall to attract projects from many disciplines, including art and design. “We have so many great students who work across boundaries in data, and we’re looking forward to seeing even more projects from them.”
VCU Libraries has long offered workshops, events, collections and expertise related to creative technologies and research communication, including the annual GIS Day in November. Workshops, panels and presentations related to the new wall will be announced soon.
“These experiences will prepare students for a future in a data-driven world, foster a sustainable level of interest in data visualization and promote interdisciplinary collaborations that enhance VCU’s cultural and economic vitality,” said Eric Johnson, who oversees content for the wall as head of creative technologies and scholarship.
One collaboration is already reflected. Catherine M. Hulshof, Ph.D., associate professor in the School of Life Sciences and Sustainability, received support from the VCU Quest Fund in part for an inspirational and educational data visualization project. She approached VCU Libraries as a potential partner, and after brainstorming, the plans for the Data Visualization Wall emerged.
In addition to Hulshof’s Quest grant, the new wall is funded through the Friends of VCU Libraries organization. A VCU Foundation Big Idea Grant will provide support for expanded computing capabilities, events and a student contest over the next 12 months.
“The generous support from a wide variety of funders for this project demonstrates confidence in VCU Libraries to serve as an interdisciplinary hub for data visualization engagement,” said Jimmy Ghaphery, associate dean for scholarly communications and publishing. “I look forward to seeing how the VCU community leverages and shapes our expanded offerings in this area.
Subscribe to VCU News
Subscribe to VCU News at newsletter.vcu.edu and receive a selection of stories, videos, photos, news clips and event listings in your inbox.